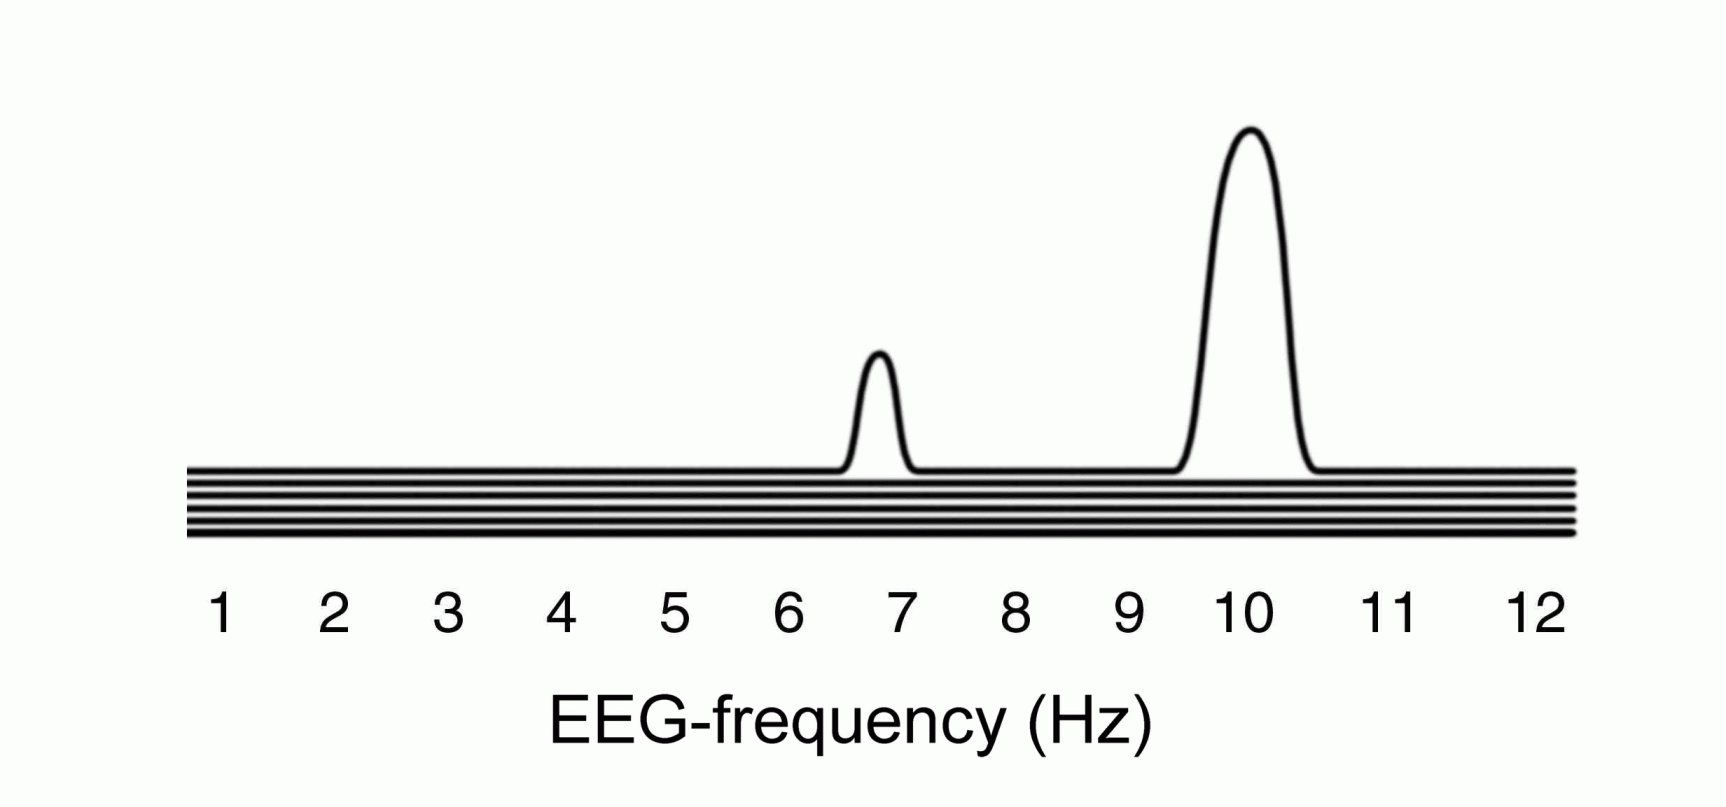
Explanation of EEG-coherence diagrams
EEG-coherence analysis is designed to find out whether the brain waves from two different parts of the brain are synchronized. Synchronization means that the crests and throughs of the waves occur simultaneously as shown in the left part of the illustration below.

A high degree of synchronization is called EEG-coherence. When coherence is found, it appears as a "wave" in the coherence diagram. The greater number of coherent waves, the higher the wave. Absence of coherence yields a straight line, see the schematic diagram below.

The position of the wave on the horizontal axis denotes the EEG-frequency of the coherent activity. One line represents the analysis result of one 5.2 second period in the EEG. The computer is programmed to start drawing lines from the bottom and to move the printer pen a small bit upward before it draws the next line.
So the coherence analysis graph is the sum of multiple lines, one drawn closely above the other, starting at the bottom of the graph. Consequently, the time axis is upwards. In the diagram above the first 5 x 5,2 seconds of the EEG shows no coherence, yielding five straight lines, while the sixth (topmost) shows coherence in the 6.8 and (higher amount) in 10 Hz frequencies.